 Express Entry Overview
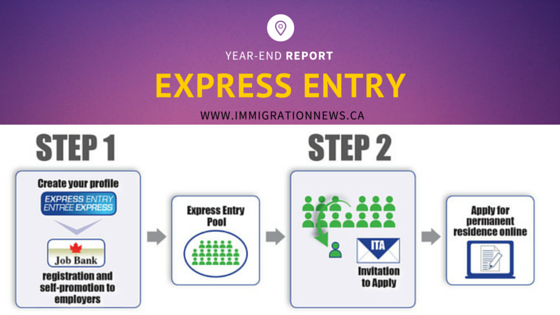
Launched in January 2015, Express Entry is Canada’s application management system for certain economic immigration programs including the Federal Skilled Worker Program, Federal Skilled Trades Program, Canadian Experience Class and a portion of the Provincial Nominee program.
Express Entry was designed with three main objectives in mind: 1) flexibility in selection and application management, 2) responsiveness to labour market and regional needs and 3) speed in application processing. Although there have been adjustments to the system during its first year and policy concerns expressed by stakeholders, Express Entry has met its expectations.
Over 31,000 invitations to apply to permanent residence have been issued to a diverse range of highly skilled immigrants and almost 10,000 individuals (principal applicants and their family) have already landed in Canada as permanent residents. Key findings indicate that professors were in the top ten occupations list and that many international students fare well in Express Entry.
Provinces, territories and employers have successfully used Express Entry to fulfill regional and labour market needs. Express Entry increases the labour market responsiveness of the immigration system through a greater role for employers who can recruit economic immigrants using the new system. When an employer is unable to find a qualified Canadian or permanent resident for a job, they can be matched with qualified Express Entry candidates through the Government of Canada’s Job Bank. All jobs offered to Express Entry candidates need to be supported by a Labour Market Impact Assessment (LMIA) to ensure the authenticity and genuineness of job offers, that the prevailing wage is respected and that employers consider Canadians and permanent residents to meet their labour needs first.
In addition, the processing time commitment of 6-months for 80% of cases has been met and Immigration, Refugees and Citizenship Canada (IRCC) will continue to monitor the performance of Express Entry and make adjustments as necessary.
Express Entry Results to Date
In the first several months of operation, IRCC planned for small and regular invitation rounds. This allowed for any necessary adjustments to the system, therefore ensuring program integrity and success. It also allowed the department to continue processing applications received prior to the launch of Express Entry. Those applications will continue to be processed throughout 2016 until completion. As anticipated, small and frequent invitation rounds in the first year have shaped the results to-date. For example, a large number of foreign nationals already working in Canada have received invitations to apply because they have job offers supported by an LMIA which awarded them 600 additional points under the Express Entry system. These early invitation rounds have also likely included foreign nationals who were unable to apply as an economic applicant before Express Entry because of occupation caps or because application space for programs was surpassed. More recently, the number of invitations to apply to the Provincial Nominee Program has increased as Provinces and Territories gain experience with the system.

Future invitation rounds from the Express Entry pool will become the main source of applications to meet annual immigration levels targets for certain economic immigration programs under the Express Entry system as the older inventories are reduced.
Express Entry Profiles submitted to the Express Entry Pool
Those who meet the criteria of one of the federal immigration programs managed by the Express Entry system (i.e. Federal Skilled Worker, Canadian Experience Class and Federal Skilled Trades Program) are accepted into a pool of candidates. Provincial Nominees participating in Express Entry must also meet the criteria of one of these three federal immigration programs.
As of January 3, 2016, a total of 191,279 Express Entry profiles were submitted by foreign nationals. Of these, 88,048 were found not eligible because they did not meet the criteria of at least one of the three programs managed by the system; 1,303 were pending due to Job Bank registration or verification of their Provincial Nomination by a Province or Territory; 63,937 were in the pool as active candidates or with an outstanding invitation to apply; and, the remaining 37,991 profiles have left the pool. Exit from the Express Entry pool occurs when a profile expired after being in the pool for a year or when a candidate does not decline an invitation to apply and does not submit an application in the 60-day mandatory period (2,656 profiles were expired as of January 3, 2016); when a profile is withdrawn from the pool by a candidate (13,684 as of January 3, 2016); or, when an application is submitted for processing (21,651 applications as of January 3, 2016).
Candidates who decline their invitation to apply are returned to the pool as active candidates.
| Profiles submitted | 191,279 |
|---|---|
| Not eligible | 88,048 |
| Pending | 1,303 |
| Active candidates | 60,042 |
|---|---|
| Invitation to apply outstanding | 3,895 |
| Expired | 2,656 |
|---|---|
| Profile withdrawn from the pool | 13,684 |
| Applications submitted for processing | 21,651 |
Composition of the Express Entry Pool
Express Entry automatically assigns a Comprehensive Ranking System (CRS) score to candidates who submit a profile. The CRS score is based on the information they provide in their profile including their age, education, official language proficiency and work experience. All information is self-reported and must be supported with appropriate documentation at the application stage or a candidate will be refused.
Candidates in the pool are ranked according to their CRS scores at the time of an invitation round. CRS scores may change as a candidate’s particular circumstances change. For example, a candidate could complete another post-secondary degree, gain more work experience or be nominated by a province or territory. The Express Entry pool is dynamic and a candidate’s rank may change as other candidates join and leave the pool.
Potential candidates can be awarded 600 additional points for a job offer or a provincial/territorial nomination. Candidates with higher CRS scores have a higher likelihood of being invited. As of January 3, 2016, the CRS scores of the 60,042 eligible foreign nationals in the pool were distributed as per the table below. This distribution is made up of candidates with a wide range of scores based on their human capital attributes, LMIA-backed job offers and provincial nominations.
| Comprehensive Ranking System Score | Number of candidates |
|---|---|
| >1000 | 236 |
| 950 – 999 | 219 |
| 900 – 949 | 191 |
| 850 – 899 | 65 |
| 800 – 849 | 66 |
| 750 – 799 | 40 |
| 700 – 749 | 22 |
| 650 – 699 | 11 |
| 600 – 649 | 1 |
| 550 – 599 | 0 |
| 500 – 549 | 46 |
| 450 – 499 | 1,613 |
| 400 – 449 | 13,537 |
| 440 – 449 | 2,486 |
| 430 – 439 | 2,842 |
| 420 – 429 | 2,185 |
| 410 – 419 | 2,899 |
| 400 – 409 | 3,125 |
| 350 – 399 | 21,851 |
| 390 – 399 | 3,144 |
| 380 – 389 | 3,989 |
| 370 – 379 | 4,814 |
| 360 – 369 | 4,878 |
| 350 – 359 | 5,026 |
| 300 – 349 | 18,433 |
| 340 – 349 | 5,107 |
| 330 – 339 | 4,611 |
| 320 – 329 | 3,898 |
| 310 – 319 | 2,883 |
| 300 – 309 | 1,934 |
| 250 – 299 | 2,832 |
| 200 – 249 | 543 |
| 150 – 199 | 238 |
| 100 – 149 | 75 |
| <100 | 23 |
| Total | 60,042 |
The above table provides a snapshot of the Express Entry pool as of January 3, 2016 but it is important to note that the pool is dynamic with profiles being created and expiring every day.
It is important to note that the distribution of the pool changes every time a new candidate enters or leaves the Express Entry pool. On January 3, 2016, when the above distribution was taken from the pool, about 900 candidates had a CRS score above 460. These are mostly candidates who enter the pool following the last invitation round of 2015. Candidates with a CRS score below 450 have never been issued an invitation to apply and the majority of them have been in the pool for more than a few months.
As displayed in the above table, more than half of the active candidates in the pool have a CRS score between 350 and 449. To improve their rank in the pool, and if applicable, these candidates could try to increase their CRS score by providing an Educational Credential Assessment for their education acquired abroad, provide language test results for their second language proficiency, provide information on their spouse or partner’s education and language proficiency.
[pro_ad_display_adzone id=”37″]Results of Express Entry Invitation Rounds to Apply for Permanent Residence
The following tables display the distribution of those invited across economic immigration programs as well as the top ten occupations, countries of residence and countries of citizenship. Over time, we expect this to continue to change as the number of invitation rounds grow.
Almost all candidates invited in the first four invitation rounds had job offers supported by LMIAs. The vast majority of these candidates were working in Canada, were familiar with Canada’s immigration system and were able to submit a profile quickly. With 600 points available for a job offer, they became top-ranked candidates. From July to December, the minimum CRS score varied between 450 and 489 and the number of invitations issued remained consistent at approximately 1,500 per round. The share of Provincial Nominees in each round increased during the last three months of 2015 as Provinces and Territories introduced their Express Entry streams. As a result, the minimum CRS score increased.
Candidates may be eligible to be invited in more than one program. At the time an invitation is sent, IRCC invites candidates to apply to a specific program. Those who are eligible for more than one program are invited according to a precedent established by IRCC. Prior to June 26, 2015, the precedent was Federal Skilled Trades, Federal Skilled Workers and Canadian Experience Class. Candidates nominated by a province or territory will only be invited as provincial nominees. For the remainder of 2015, a shift was made to invite candidates as Federal Skilled Workers, Canadian Experience Class and Federal Skilled Trades based on clients’ feedback. The precedent does not affect who is invited as it does not change the Comprehensive Ranking System score. The exact same candidates would be invited under a different program.
| Round | Date | Comprehensive Ranking System Cutoff | Invitations Issued | Above 600 pts | Provincial nominees | Federal Skilled Workers | Federal Skilled Trades | Canadian Experience Class |
|---|---|---|---|---|---|---|---|---|
| 1 | Jan. 31 | 886 | 779 | 100% | 13 | 432 | 163 | 171 |
| 2 | Feb. 7 | 818 | 779 | 100% | 17 | 167 | 221 | 374 |
| 3 | Feb. 20 | 808 | 849 | 100% | 0 | 0 | 0 | 849 |
| 4 | Feb. 27 | 735 | 1,187 | 100% | 24 | 114 | 409 | 640 |
| 5 | Mar. 20 | 481 | 1,620 | 75% | 43 | 500 | 336 | 741 |
| 6 | Mar. 27 | 453 | 1,637 | 20% | 3 | 1,187 | 103 | 344 |
| 7 | Apr. 10 | 469 | 925 | 70% | 24 | 329 | 159 | 413 |
| 8 | Apr. 17 | 453 | 715 | 41% | 35 | 389 | 87 | 204 |
| 9 | May 22 | 755 | 1,361 | 100% | 278 | 240 | 253 | 590 |
| 10 | June 12 | 482 | 1,501 | 68% | 150 | 526 | 104 | 721 |
| 11 | June 26 | 469 | 1,575 | 40% | 111 | 925 | 52 | 487 |
| 12 | Jul. 10 | 463 | 1,516 | 44% | 96 | 829 | 68 | 523 |
| 13 | Jul. 17 | 451 | 1,581 | 20% | 42 | 1189 | 31 | 319 |
| 14 | Aug. 7 | 471 | 1,402 | 69% | 223 | 525 | 76 | 578 |
| 15 | Aug. 21 | 456 | 1,523 | 42% | 164 | 901 | 35 | 423 |
| 16 | Sept. 8 | 459 | 1,517 | 50% | 198 | 680 | 50 | 589 |
| 17 | Sept. 18 | 450 | 1,545 | 35% | 177 | 900 | 34 | 434 |
| 18 | Oct. 2 | 450 | 1,530 | 50% | 265 | 682 | 50 | 533 |
| 19 | Oct. 23 | 489 | 1,502 | 90% | 619 | 271 | 70 | 542 |
| 20 | Nov. 13 | 484 | 1,506 | 86% | 599 | 305 | 74 | 528 |
| 21 | Nov. 27 | 472 | 1,559 | 52% | 319 | 735 | 72 | 433 |
| 22 | Dec. 4 | 461 | 1,451 | 29% | 158 | 875 | 24 | 394 |
| 23 | Dec. 18 | 460 | 1,503 | 65% | 547 | 513 | 45 | 398 |
| Total: | 31,063 | 60% | 4,105 | 13,214 | 2,516 | 11,228 | ||
| CRS Score | Number of Active Candidates | Number of Invitations Issued |
|---|---|---|
| >1000 | 236 | 3,357 |
| 950 – 999 | 219 | 2,383 |
| 900 – 949 | 191 | 2,976 |
| 850 – 899 | 65 | 2,849 |
| 800 – 849 | 66 | 3,075 |
| 750 – 799 | 40 | 2,601 |
| 700 – 749 | 22 | 1,033 |
| 650 – 699 | 11 | 267 |
| 550 – 599 | 0 | 12 |
| 500 – 549 | 46 | 1,259 |
| 450 – 499 | 1,613 | 11,222 |
| 400 – 449 | 13,537 | – |
| 350 – 399 | 21,851 | – |
| 300 – 349 | 18,433 | – |
| 250 – 299 | 2,832 | – |
| 200 – 249 | 543 | – |
| 150 – 199 | 238 | – |
| 100 -149 | 75 | – |
| <100 | 23 | – |
| Total | 60,042 | 31,063 |
| Core CRS Score | # of Active Candidates | Invitated candidates without a job offer or provincial nomination | Invitated candidates with a job offer or provincial nomination |
|---|---|---|---|
| 550 – 599 | 0 | 12 | 1 |
| 500 – 549 | 48 | 1,259 | 134 |
| 450 – 499 | 1,640 | 11,222 | 662 |
| 400 – 449 | 13,744 | – | 2560 |
| 350 – 399 | 22,070 | – | 2383 |
| 300 – 349 | 18,624 | – | 2976 |
| 250 – 299 | 2,897 | – | 2849 |
| 200 – 249 | 609 | – | 3075 |
| 150 – 199 | 278 | – | 2601 |
| 100 -149 | 97 | – | 1033 |
| <100 | 35 | – | 296 |
| Total | 60,042 | 12,493 | 18,570 |
The above tables depict the distribution of active candidates in the Express Entry pool and invitations issued, broken down by total CRS score and by Core CRS score. Core CRS indicates a candidate’s score without the additional 600 points for a job offer or a provincial nomination. Depicted in bar chart format:

Based on the above bar chart, the Core CRS scores of invitations issued with job offers or provincial nominations are, on average, lower than the Core CRS scores of those without.
It should be noted, however, that candidates with a job offer or provincial nomination that have been invited to apply under the Canadian Experience Class do not require an Educational Credential Assessment. Since an ECA is required to be awarded CRS points for foreign postsecondary education, Core CRS scores may not reflect these candidates’ actual human capital score.
Round Results: Provincial/Territorial participation
| PNC Province/Territory | Number of candidates |
|---|---|
| British Columbia | 1,528 |
| Manitoba | 110 |
| New Brunswick | 127 |
| Newfoundland and Labrador | 1 |
| Nova Scotia | 656 |
| Northwest Territories | 8 |
| Ontario | 871 |
| Prince Edward Island | 163 |
| Saskatchewan | 497 |
| Grand Total | 3,960 |
IRCC has issued 4,105 invitations to candidates under the Provincial Nominee Program. However, certain candidates received more than one invitation. A total of 3,960 unique candidates have been issued invitations. Only provinces and territories who have nominated candidates to date have been included in this table. Some jurisdictions launched their Express Entry streams throughout 2015 and only started nominating candidates in mid-year. It is also important to note that the number of allocated nominations varies by jurisdiction and is based on a number of factors, including labour market information and population size.
Round Results: Occupations of Invited Candidates
Express Entry has introduced an employer role into the immigration process. Employers may connect with Express Entry candidates using the Job Matching service of Job Bank. Employers may also connect with foreign nationals outside of Express Entry but the foreign national must become an Express Entry candidate before receiving an invitation to apply.
As the economic immigration programs are designed for high skilled immigration, all job offers are in professional or skilled trade occupations defined by the National Occupation Code maintained by Employment and Social Development Canada (NOC 0, A and B) and each offer is supported by a Labour Market Impact Assessment.
Candidates with job offers are awarded 600 points to ensure employers’ needs are met. The mix of occupations of invited candidates has been determined, in part, by the combination of small invitation rounds and a large number of candidates with job offers.
| Top 10 Invited Occupations | Number# | % |
|---|---|---|
| NOC6311 – Food service supervisors | 2,356 | 8% |
| NOC6322 – Cooks | 2,295 | 8% |
| NOC2171 – Information Systems Analysts and Consultants | 1,255 | 4% |
| NOC2173 – Software Engineers | 940 | 3% |
| NOC2174 – Computer Programmers and Interactive Media Developers | 935 | 3% |
| NOC4011 – University professors and lecturers | 745 | 3% |
| NOC6211 – Retail sales supervisors | 669 | 2% |
| NOC5241 – Graphic Designers and Illustrators | 550 | 2% |
| NOC1111 – Financial Auditors and Accountants | 494 | 2% |
| NOC1112 – Financial and Investment Analysts | 446 | 2% |
| Top 10 | 10,685 | 38% |
Candidates working as Food Service Supervisors (NOC 6311) or Cook (NOC 6322) were the largest group of invited candidates in 2015 followed by IT professionals (NOC 21), business and finance professionals (NOC 11) or university professors (NOC 40). Those with NOC 63 are more likely to have a lower human capital and a valid job offer while those in NOC 11, 21 and 40 often have high human capital with no valid job offer (their CRS score was in the 450-599 range).
Country of Residence and of Origin of Invited Candidates
In the early months of Express Entry, Canada was the predominant country of residence for invited candidates because of the high number of foreign workers with LMIA backed job offers that wished to settle in Canada permanently. The country of origin reflects the origin of qualified candidates from the pool. It is anticipated that the top ten countries will continue to shift as more candidates are invited to apply.
| Country of Residence | Number# | % |
|---|---|---|
| Canada | 22,111 | 78.1% |
| India | 1,745 | 6.2% |
| United States of America | 622 | 2.2% |
| China, People’s Republic of | 409 | 1.4% |
| England | 294 | 1.0% |
| Philippines | 283 | 1.0% |
| Nigeria | 248 | 0.9% |
| United Arab Emirates | 213 | 0.8% |
| Pakistan | 159 | 0.6% |
| France | 135 | 0.5% |
| Top 10 | 26,219 | 92.6% |
| Country of Citizenship | Number# | % |
|---|---|---|
| India | 6,348 | 22.4% |
| Philippines | 3,574 | 12.6% |
| China, People’s Republic of | 1,678 | 5.9% |
| United Kingdom | 1,644 | 5.8% |
| Ireland, Republic Of | 1,210 | 4.3% |
| United States of America | 949 | 3.4% |
| Nigeria | 609 | 2.2% |
| South Korea | 605 | 2.1% |
| France | 566 | 2.0% |
| Australia | 540 | 1.9% |
| Top 10 | 17,723 | 62.6% |
| Country of Citizenship | 2014 intake (FSW, CEC, FST) |
|---|---|
| India | 33.9% |
| China, People’s Republic of | 9.9% |
| Philippines | 8.2% |
| Pakistan | 6.6% |
| Nigeria | 4.8% |
| Bangladesh | 3.6% |
| United Kingdom | 3.0% |
| Iran | 2.7% |
| Egypt | 2.6% |
| United States of America | 1.9% |
| Top 10 | 77.1% |
While it is too early to conclusively explain this shift in country of citizenship, some of the possible factors may include the structure of the Comprehensive Ranking System and its emphasis on language proficiency and educational credentials.
Applications for Permanent Residence through Express Entry
As indicated in the table below, IRCC received 21,562 applications from candidates who were invited to apply for permanent residence during the invitation rounds, which represent 37,424 applicants and their family members. The majority of the applications are still in progress but 14,058 were approved resulting in 13,241 visas issued to principal applicants and their dependants; and, 9,739 admissions in Canada.
| Application Received | Applications in Progress | Applications Approved | Visas Issued | Admissions |
|---|---|---|---|---|
| 37,424 | 15,246 | 14,058 | 13,241 | 9,739 |
| Province of Destination | FSW | CEC | FST | PNP | All Programs |
|---|---|---|---|---|---|
| Alberta | 1,974 | 4,637 | 1,385 | – | 7,996 |
| British Columbia | 1,672 | 1,295 | 199 | 1,218 | 4,384 |
| Manitoba | 77 | 48 | 9 | 103 | 237 |
| New Brunswick | 29 | 19 | 2 | 89 | 139 |
| Newfoundland | 29 | 17 | 14 | – | 60 |
| Northwest Territories | 11 | 15 | 1 | 5 | 32 |
| Nova Scotia | 103 | 48 | 5 | 497 | 653 |
| Nunavut | 3 | 5 | – | – | 8 |
| Ontario | 4,670 | 1,833 | 199 | 646 | 7,348 |
| Prince Edward Island | 7 | 5 | – | 122 | 134 |
| Quebec | – | 3 | – | – | 3 |
| Saskatchewan | 111 | 117 | 30 | 299 | 557 |
| Yukon | 7 | 4 | – | – | 11 |
| Grand Total | 8,693 | 8,046 | 1,844 | 2,979 | 21,562 |
The majority of Express Entry candidates who submitted a permanent residence application to IRCC chose Alberta, Ontario or British Columbia as province of destination. This aligns with destination provinces prior to Express Entry and has been explained by a combination of community connections, services, infrastructure and most importantly, jobs.
Express Entry Processing Times
The processing time standard for applications sourced via Express Entry is six months for 80% of cases. Processing times are measured from the day a complete application is received until a final decision is made by an immigration officer. IRCC is meeting processing time commitments for all cases finalized.
These are early results based on a small volume of applications and it is anticipated that processing times may likely grow in parallel with application volumes. Processing times will continue to be monitored closely and any necessary action will be taken to continue meeting service standards such as adjustments to processing, measures to increase the quality and completeness of received applications, or reducing the number of invitations issued.
| Application data | Federal Skilled Workers (EE) | Canadian Experience Class (EE) | Skilled Trades (EE) | Provincial/ Territorial Nominees (EE) |
Total EE |
|---|---|---|---|---|---|
| 80% of applications finalized in x months or less | 4.7 | 3.5 | 4.9 | 3.8 | 4.4 |
| Applications finalized | 3,223 | 9,861 | 2,330 | 1,077 | 16,491 |
Applications finalized, in the table above, refers to applications approved (14,058) and refused (2,433) up to January 3, 2016
Additional Analysis: Specific groups in Express Entry
International Students
Under Express Entry, the Comprehensive Ranking System does not distinguish between a degree issued in Canada versus one assessed as equivalent to a Canadian degree. This is because there is insufficient evidence to support a relationship between holding a Canadian degree versus a degree issued overseas (assessed as equivalent to a Canadian degree) and improved economic outcomes within Canada.
In general, the Express Entry system is favourable to international students and post-graduate work permit holders because they are awarded a significant benefit by the ranking system for their high education, Canadian work experience, strong official language skills and, more often than not, youth.
In fact, Express Entry active candidates in the pool who have ever been in possession of a study permit have a higher median CRS score in comparison with others in the pool, respectively 408 and 360 as of November 23, 2015 Footnote1. The table below shows the distribution of individuals in the pool who have had a Canadian study permit. A large proportion of them have a CRS score between 376 and 475. In comparison, individuals in the pool who have never had a Canadian study permit are mostly agglomerated at a CRS score of 300 to 400.
| CRS score | Yes # | Yes % | No # | No % | Total |
|---|---|---|---|---|---|
| 1-100 | 0 | 0 | 26 | 100 | 26 |
| 101-200 | 15 | 5 | 312 | 95 | 327 |
| 201-300 | 160 | 5 | 3,331 | 95 | 3,491 |
| 301-325 | 307 | 5 | 6,223 | 95 | 6,530 |
| 326-350 | 583 | 5 | 10,821 | 95 | 11,404 |
| 351-375 | 980 | 8 | 10,771 | 92 | 11,751 |
| 376-400 | 1,290 | 14 | 7,650 | 86 | 8,940 |
| 401-425 | 1,800 | 27 | 4,949 | 73 | 6,749 |
| 426-450 | 1,941 | 33 | 3,985 | 67 | 5,926 |
| 451-475 | 508 | 31 | 1,138 | 69 | 1,646 |
| 476-500 | 92 | 23 | 315 | 77 | 407 |
| 501-600 | 8 | 22 | 28 | 78 | 36 |
| 601 or more | 99 | 18 | 461 | 82 | 560 |
| Total | 7,783 | 13 | 50,010 | 87 | 57,793 |
| Median score | 408 | – | 360 | – | 365 |
Data in the above table are produced by linking data in two or more datasets. Differences in spelling of certain data elements being used for this linkage may result in slight undercounting. As such, the data should be considered as approximations.
In addition, in 2015, proportionally more Express Entry candidates who have been invited to apply (22%) had a study experience in Canada in comparison to those in the pool (13%).
| EE status | Yes # | Yes # | Yes % | No # | No % |
|---|---|---|---|---|---|
| PNP | 1,151 | 39 | 1,827 | 61 | 2,978 |
| FSW | 2,947 | 29 | 7,355 | 71 | 10,302 |
| CEC | 1,243 | 13 | 7,996 | 87 | 9,239 |
| FST | 70 | 3 | 2,161 | 97 | 2,231 |
| Total | 5,301 | 22 | 18,908 | 78 | 24,209 |
Data in the above table are produced by linking data in two or more datasets. Differences in spelling of certain data elements being used for this linkage may result in slight undercounting. As such, the data should be considered as approximations.
Most full-time international students who graduate from their program in Canada are eligible for open work permits through the Post-Graduation Work Permit Program. This allows them to gain experience in the Canadian labour market which is awarded points under the Express Entry Comprehensive Rankling System; and, it that may help them transition to permanent residency.
Francophones
While the number of French-speaking candidates in the Express Entry pool is still very small, Express Entry has the potential to contribute to the vitality and to support the development of Canada’s Francophone Minority Communities (FMC). In addition, candidates who speak English and French can receive additional points for their bilingualism, which increases their rank in the pool.
Express Entry active candidates in the pool who have submitted results to the Test d’évaluation du français (TEF) for their first official language have a higher median CRS score in comparison with others in the pool, respectively 384 and 374 as of January 3, 2016.
In 2015, 2% of invited candidates were French-speaking, though they only represented 1% of candidates in the Express Entry pool. While these percentages appear small, the department is currently exploring ways to increase the amount of French-speaking candidates interested in applying to come to Canada through Express Entry.
Conclusion
This report demonstrates that in 2015, Express Entry welcomed a diverse range of highly skilled candidates. Provinces, territories and employers have successfully used Express Entry to fulfill regional and labour market needs.
The processing time commitment has been met and the Department continues to monitor results, and improve and innovate on its processes and policies.
In 2016, we expect that these accomplishments will continue as Express Entry further stabilizes and the pre-Express Entry inventory is processed to completion.
Source: cic.gc.ca